- Type
- Audio Effect
- Author
- ZlatkoBaracskai
- Version
- 1.0
- License
- None
- Live version
- 8.2.2
- Max version
- 5.1.8
- Downloads
- 321
- Updated
- No Updates
Description
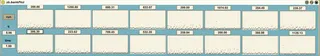
zb.bankPlot is a plotting device, which is especially useful for monitoring particular frequency bands over time.
The number boxes set the centre monitoring frequency for each graph.
The graph windows display a plot of peak amplitude against time.
The q parameter controls the steepness of the filter, resulting in a narrower frequency display.
The time parameter controls the speed of plotting.